

“Profit, and cash flow, are like oxygen. You don’t realize how much you need them until suddenly, you don’t have them.”
Gregory Cleary & Michael Erath, The Path to The Pinnacle
This is the longest, and most detailed article in the series. I chose to keep it this way because I don’t want to just give you high-level concepts, but rather real-world examples and ways to actually begin doing specific things that will make an immediate impact on your organization’s financial health.
The Importance of Resilience – A Personal Lesson Learned
When the terrorist attacks happened on September 11, 2001, I was thirty years old and the President and CEO of Erath Veneer. We manufactured and sold hardwood veneer and about eighty percent of our business was export, primarily to Europe and Asia. Our customers would typically travel to the US every one or two months to inspect and purchase product.
Even though the closure of airspace in North America only lasted two days, it took six to nine months before our overseas customers began to return to travel. Many of them were distributors, and they had large inventories and low overheads, so they survived off of their inventories during the global economic lull that followed. We, on the other hand, were a manufacturer, with significant fixed cost structures and debt service.
Our sales dropped an average of 60% in the two quarters following the attacks, and we quickly ran dangerously low on cash. In my youth, I was aggressively growing the business, focusing on opening new markets and expanding capacity, but I wasn’t intentional about simultaneously building a war chest of cash reserves and assuring sufficient access to capital, so our balance sheet was not in the position to weather such a storm.
While we did survive and go on to begin growing again, it would not be until 2 years later, when I joined the Young Presidents Organization (YPO), that I would begin to really learn and understand the tools and concepts I needed to build a more resilient company. Many of those tools and concepts provide the framework for this article.
To read more about Michael’s own entrepreneurial journey, a journey filled with successes, failures, a business partner’s embezzlement and fraud, felony convictions, and federal prison time, followed by his rebirth from the ashes of it all, read or listen to RISE: The Reincarnation of an Entrepreneur. A journey about which well know author and founder of the COO Alliance, Cameron Herold says, “I’ve met countless entrepreneurs over the course of my two-plus decades in business, but few have stories as dramatic—and, in the end, as inspirational—as Michael Erath’s.”
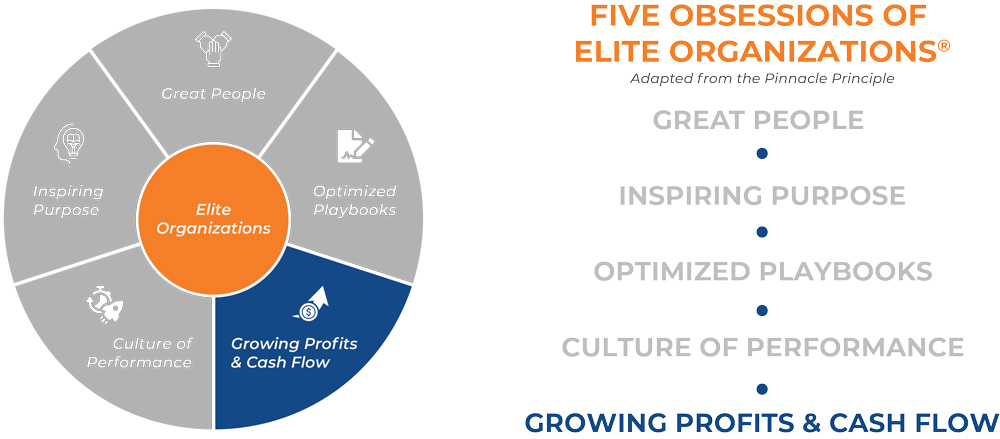
Over the course of my career as both an owner of multiple businesses and now a mentor and Business Guide to many more, I have seen how many entrepreneurs, and even many business operating systems, view profit and cash flow as the result of everything else. While in theory that thought process makes sense, I believe that to truly build an elite organization, the entire premise on which Next Level Growth was created, you must be intentional and proactive about the fifth of the Five Obsessions of Elite Organizations®, Growing Profits & Cash Flow.
In this final article in our series on the Five Obsessions of Elite Organizations, I will take you through five disciplines and concepts that I hope will be both easy to understand and begin to implement, and which will also help you improve both your profitability and your net cash flow quickly. They are: Internal Financial Literacy, Profit per X, Cash Conversion Cycles, Cash Flow Forecasting, and the Power of One.
Internal Financial Literacy
Many business owners are reluctant to share financial statements and other measures of financial performance with their leadership teams out of a fear that the people around them will either get distracted, or greedy, if they know the profitability of the company, or scared knowing how much the company might be losing in slow times. I would argue, however, that if an entrepreneur surrounds themselves with leaders who do not have either the financial understanding of, or the appreciation for, the risks the entrepreneur is taking and often personally liable for, then they have the wrong leaders sitting around the table.
For much of my early career, I was also one of those entrepreneurs who concealed financial statements from everyone other than my Controller. It wasn’t until I hired my first true CFO, and also through continuing to read and learn about best practices from my YPO colleagues and authors like Greg Crabtree and Jack Stack, that I began to come around and eventually created a monthly financial review meeting with my leadership team. That step was transformational both in opening their eyes to understanding how day to day decisions they and their teams were making had a broader impact on the company, and also in allowing me to delegate the burden of being the only one in leadership who really carried the stress of the financial roller coaster on which entrepreneurial organizations often ride.
Monthly Financial Review: A Best Practice Recommendation
As I evolved as a leader, I worked with our Controller to create a spreadsheet to which we would export a budget to actual variance analysis report from our financial software as soon as the months were closed. This report listed, each month, what our budget, or forecast predicted, what our actual results were, and then showed the variance. Every line item on the financial report, and this was a detailed, not consolidated version, had the name of a leadership team member next to it based on who within our Next Level Accountability Chart™ was ultimately accountable for that line item.
Any line items that were outside of a pre-determined range in terms of their actual results from what was budgeted or forecast would be highlighted in yellow. This report was distributed to the leadership team as soon as it was ready, and the following week we would add thirty minutes to our Weekly Tactical Meeting and start with a Financial Review. For any line item highlighted in yellow, the leadership team member who was accountable for that line was expected to be prepared to present an update to the team.
Notice that I didn’t say we just highlighted items that missed budget. We highlighted everything that was outside of a predetermined range. If a number was off budget in a negative way, the leadership team member accountable was expected to present to the team on specifically why the number was off, what was being done to correct it going forward, and/or anywhere they were stuck and needed help. Conversely, if the number was off track to the good, they were expected to also present on specifically why they were able to beat budget, what they learned as a result, and how they were going to adjust systems, process playbooks, people, etc., going forward in order to improve future performance based on what they had learned.
That second part is very important. As dangerous as it is to not understand why you are underperforming, it is equally as dangerous to achieve successes and not clearly understand why.
In addition to the profit and loss statement review through the budget to actual variance report analysis, we also would review our Statement of Cash Flow on a monthly basis. Combining this with the financial review helped our team understand how much cash was increasing or decreasing based on operations, financing activities, and investing activities. The more they understood the connection between decisions in the field and the financial impacts on the business, both in terms of profit and net cash flow, the more equipped they were to make intelligent and informed decisions on a daily basis and the more autonomy they gained in their roles.
It didn’t take long before leadership team members, as soon as they received the monthly spreadsheet, would do things like go to our finance team and ask for a printout of the general ledger for lines that were off track and for which they were accountable. Over time, it created a powerful collaboration between the finance team and the rest of the leaders in the organization. A collaboration that would make all of us smarter and more aligned as a team, and which would benefit the organization greatly.
Profit per X
In his 2001 best-selling book, Good to Great, author and thought leader Jim Collins writes, “The Good-to-Great companies frequently produced spectacular returns in very unspectacular industries. Each of them gained profound insights into their economics and as a result built a fabulous economic engine.”
He goes on to explain the concept of “Profit per X,” where the “X” is your “economic denominator.” The one denominator that, if you consistently and methodically worked on growing the ratio of profit per that economic denominator, you would build an outstanding financial engine for the business.
The first time I really wrapped my head around the concept and was able to get very granular, was during my time as President and CEO of Erath Veneer. Many organizations will claim their Profit per X is something like Profit per Employee. Whenever I see that, or hear a coach suggest that, it tells me that they don’t truly understand the concept, nor the power, of Profit per X.
I like to think through Profit per X based on the logic of the simple illustration below. This is actually a whiteboard capture from work I did with one of our Next Level Growth clients as we worked on discovering their Profit per X.
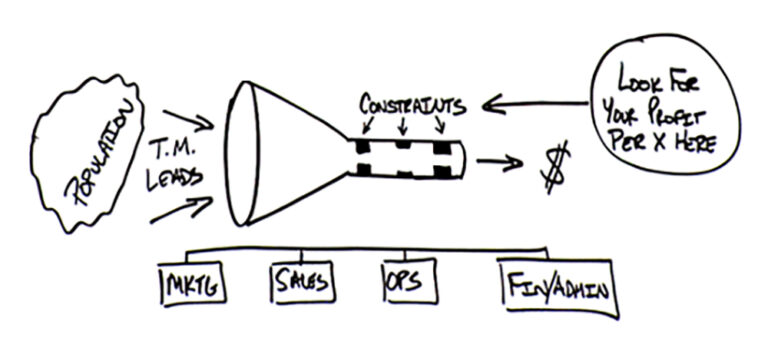
If you think of your organization as a sideways funnel, you have to extract target market leads from some population of possible leads, convert those leads to customers or clients, create and provide goods or services, and you have to get paid. Somewhere in that funnel, every organization has a single most critical constraint, or key choke point, that holds the key to driving their economic engine through a focus on Profit per X. Note that every organization has more than one, but to get the greatest impact and not get distracted, you must choose one and only one, that will have the greatest impact on your economic engine.
In the case of our manufacturing business, our biggest constraint was our production capacity. We were a smaller player in a big industry, and the cost of adding just one new production line would be around three-million dollars, and that is just for the equipment. That doesn’t include building expansion, installation costs, and startup costs. Growing our profit by physically expanding our production was cost prohibitive.
At the same time, most of our Operating Expenses (OpEx) were largely fixed costs, with only a few lines of OpEx on our financials being pure variable costs. We knew that until we generated enough dollars of gross profit to cover those heavily fixed OpEx costs, we would not reach profitability. That was what we referred to as our “monthly nut.” The exact amount of Gross Profit Dollars it would take us just to reach break-even for the month.
Armed with that knowledge and thinking about Profit per X in terms of constraints, we soon realized that if we could analyze and consistently make decisions to improve our dollars of gross profit per board foot produced (board feet is a standard unit of measure in the hardwood industry), then we could absolutely build a strong economic engine. We wrote our Profit per X as “$GP/BF” and it became everything to us.
So what about professional service type businesses that are not producing something as standardized as in my personal example? In most of those cases, I find that human capital is often their greatest constraint. That causes some people to then suggest that profit per employee is the right answer. But the reason I feel that is a mistake is that different employees come at different costs and provide different levels of value. In my opinion, a much better Profit per X in the professional services space is to look at your Profit (Net or Gross) per Fully Burdened Human Capital Dollar Invested. When you look through that lens, the analysis and adjustments take on a much more impactful meaning.
Discovery Is Only the First Step – The Gold is in the Analysis and Adjustments
We analyzed and then adjusted our production mix and changed our sales strategies to focus on species (think product lines) that would help us improve our $GP/BF. We analyzed and ranked all of our buyers in the field by $GP/BF for each specie we produced. Based on that data, we adjusted their budgets and quotas by specie based on their individual performance so that our highest performers relative to their $GP/BF were focused on the species where they performed best. We implemented bonus plans for the high performers to share in their profitability.
We analyzed our suppliers by specie based on $GP/BF, shared that information with our procurement team, and made adjustments to maximize our volume purchased from the highest performing vendors. We analyzed and prioritized our customers the same way. With a finite inventory from which to sell, we looked at, by specie, which customers had the highest $GP/BF and we adjusted our sales efforts to prioritize those customers at the top.
Over the course of just a few quarters, as all of our analysis and adjustments began to pay off, we saw an average monthly gain in Gross Profit of just over $100,000. We achieved that without any capital expenditures and without spending any additional OpEx, which meant that essentially every gained dollar of Gross Profit fell to the bottom line and improved our profitability and net cash flow. It was worth more than $1,000,000 of increased profit annually.
Where are your constraints? If you think through each of them, do you gain any clarity on which one of them, if you consistently grew the ratio of profit per that constraint, would allow you to build a fabulous economic engine? This is hard work and takes intentional focus, but the results are absolutely worth the effort.
Cash Conversion Cycles
Everyone knows that starting a business requires cash, and growing a business requires even more. Growing businesses can consume massive amounts of cash for working capital, facilities, equipment, and operating expenses. But few people understand that a profitable company that tries to grow too fast can run out of cash. A key challenge for the leadership team of any growing business, is to find the proper balance between consuming cash and generating it. Fail to strike that balance, and even a thriving company can soon find itself out of business…a victim of its own success.
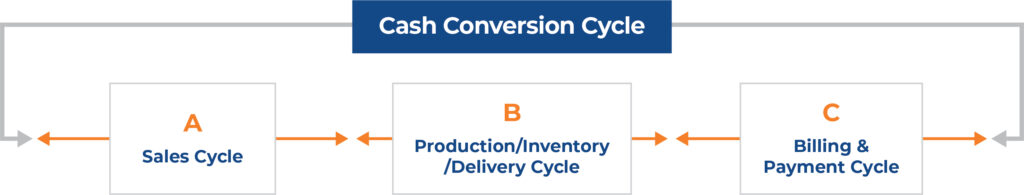
The keys to improving your cash conversation cycle are based on making consistent, incremental improvements in the key components impacting the time it takes a dollar invested to return to the business as a dollar received. Referencing the image above, the key components of a Cash Conversion Cycle (CCC) are typically:
Sales Cycle: From the time you start investing in the sales process with a prospect, until you have a confirmed order to hand off to operations, you have cash going out of the business.
For example, you may have a salesperson take a prospect out to dinner. Cash left the business to pay for the dinner that contributes to the relationship you expect will lead to a confirmed order. Maybe that dinner was a “warm meeting” to ask for a demo or discovery meeting with a broader team. The speed with which your salesperson is able to get the prospect to move from the warm meeting phase to the demo phase, can have a positive or negative impact on your CCC.
When the prospect comes for the demo, do you have a clear ask at the end, or is it open ended? Are you intentionally doing everything you can to guide the prospect to make a decision? That decision may be a hard “no,” in which case you can stop spending cash to try to convert them and go focus on the next prospect, or it may be a “yes,” in which case we can quickly move to the next phase. If you allow them to flap endlessly in the wind without getting to a decision, the cash you have invested to this point is also flapping in the wind, far from your grasp.
Be smart and intentional about decreasing the time it takes for a prospect to move through your sales cycle and you will increase the velocity of cash flowing back into the business.
Production/Inventory/Delivery Cycle: For a business that produces any kind of goods, you can look at your Production & Inventory Cycle as the time from when you procure your inputs, to the time they go into Work in Process, then into Finished Goods Inventory, and finally out the door to a customer. Most businesses can find opportunities to improve one or more of these segments within a Production, Inventory, and Delivery Cycle.
For a professional services business, there are still elements of this that apply. While you may not have raw materials and finished goods inventory, an accounting firm still has a Production and Delivery cycle. The key to improvement is in looking for all the small, incremental improvements you can make in your processes and workflows that will reduce the time it takes to move through the cycle.
Billing & Payment Cycle: This is the amount of time it takes from the delivery of a good or service, to the time the cash lands back in your account. This is a key area where many businesses lose focus, and, as a result, waste cash.
Let’s start with the billing cycle. When I dig into Cash Conversion Cycle with clients, one of the questions I ask is, “On average, how long does it take from the delivery of your service (I find this is typically much worse with service-based businesses than with product-based businesses) until the customer receives an invoice?” I’ve literally had clients tell me that they hold all invoicing until the end of the month, or worse, that they’re really busy and it usually takes a week or two to get the invoices out. If you take a six-million dollar business with consistent sales, we could presume that they bill $500,000 monthly, or roughly $125,000 per week. If they take 2 weeks just to get an invoice to the customer, they are missing a $250,000 opportunity.
In the example above, if the reason it takes two weeks is because the accounting team is understaffed, and they then say that they cannot “justify” adding another person to overhead, that tells me they are driving with blinders on. If adding one administrative person to the finance team would allow them to get invoices out within one business day, then once those invoices cycle through AR, the company’s cash will increase by $250,000. For a position that might cost $50,000, which might be a fully burdened monthly cost to the company of around $5,500, justification of the position should not be the issue – the new employee is essentially free. And if within 3 months of their onboarding, the company has gained a $250,000 improvement in cash, and their 3-month investment in the person has been about $15,000, I would argue that is an outstanding Return on Investment.
That brings up the next part of this final cycle, the payment cycle. At Erath Veneer, our typical payment terms were Net 30 Days. In reality, customers have a tendency to pay when they pay, and most organizations (ours was no different), simply accept it as they don’t want to upset a customer. Before we started really focusing on it, our average days to pay, with terms of Net 30 days, was running in mid-50-day range, and our Accounts Receivable (AR) would vary around +/- $1,500,000.
There was a time where we would have a member of our accounting team call customers who were past due to inquire about payment. The problem with that was most of those calls would be routed to someone within the customers accounting team. The result was that the two people on the phone had misaligned objectives. Our collections team member was trying to get cash in as quickly as possible, and the person they were talking to was trying to hold on to cash as long as they could. When we made the change to task our salespeople with collecting their own AR, they would talk with their colleague, the buyer, on the other side of the open invoice, and there was always a better relationship between those two people. Also, the buyer often had more leverage within their own company, and one of their objectives was to maintain vendor relationships to ensure they had access to the resources they needed, so there was an incentive to collaborate.
A few other things we did that had measurable impact included modifying how we expressed the payment terms. In addition to stating “Net 30 Days” on the invoice, we would also list the date that marked the 30 days, so instead, our invoices would read, “Net 30 Days – Due February 3rd.” There is always an assumption from the seller that Net 30 Days means from the date of the invoice, but the buyer almost always takes the position that it is from the date the invoice was received. By including the actual due date, in many instances, that alone improved the average days it took a specific customer to pay by 3 to 5 days.
Think about that…if one of our customers typically carried $100,000 in AR and their average days to pay was 50, and just the minor modification above led to a small change in behavior on their end that got us paid just 3 days faster, that is a 6% reduction in AR days for that client, which is worth $100,000 x 6% = $6,000 of improved cash flow. Multiply that across multiple accounts, and the numbers add up very quickly.
Another thing we did, and that I find is an opportunity many companies miss, is sending a “friendly reminder” of an upcoming due date. Many companies wait until an invoice goes past due to begin communicating about that particular invoice, and I believe that is a missed opportunity. We implemented a simple process by which we would send a friendly reminder 10 days before an invoice was due, with a very positive short note about how much we valued the relationship and appreciated their collaboration and timely payment. If we knew who within their accounting team held the keys to getting us paid, we would send the email to them, and we would always copy their buyer. It was a soft, subtle reminder that they needed good vendors, and we needed good customers who would live up to their obligations to pay us on time.
Just implementing those two simple, and essentially zero-cost adjustments, our average AR days dropped from the mid-50s to the upper 40s. While that may not sound like a big move, the impact of a 7-day average reduction in AR days, was an improvement of about 13%, and with an average AR of around $1,500,000, a 13% improvement created roughly $195,000 of improved cash flow that we could re-deploy back into growing the business.
Cash and Cash Flow Forecasting
Most entrepreneurs are familiar with the statement, “Revenue is vanity, profit is sanity, and cash is king.” While this statement is not untrue, I think there is significant flaw…I would say that it is not “cash” that is king, but “cash flow.”
The reason I consider cash flow more important than cash is due to its dynamic nature and its direct reflection of a company’s operational health. Here are several reasons why:
1. Timeliness and Relevance: Cash flow reflects the inflow and outflow of cash over a specific period, providing a real-time view of a company’s financial situation. It accounts for operational expenses, investments, and financing activities, offering a more accurate and current assessment compared to a snapshot of cash at a single point in time.
2. Operational Sustainability: Positive cash flow indicates that a company is generating more cash than it is spending, signifying the ability to cover its ongoing expenses, invest in growth opportunities, and meet its financial obligations. It ensures the day-to-day operations can continue smoothly.
3. Investment and Growth: Cash flow is crucial for funding expansion, innovation, and strategic initiatives. Companies with healthy cash flows have the ability to invest in research, development, acquisitions, or new market penetration, driving growth and competitiveness.
4. Debt Servicing and Financial Health: Cash flow is instrumental in servicing debt obligations, including interest payments and debt reduction. Lenders often assess cash flow to determine a company’s ability to repay loans. A strong cash flow history can improve creditworthiness and reduce borrowing costs.
5. Risk Management: Regular monitoring of cash flow helps identify potential financial issues or liquidity problems in advance. It allows management to make informed decisions to mitigate risks, adjust strategies, or seek additional financing if necessary.
6. Investor and Stakeholder Confidence: Investors and stakeholders often scrutinize cash flow statements to assess a company’s financial stability and growth potential. A consistent positive cash flow demonstrates financial discipline and can attract investment and confidence from stakeholders.
While cash reserves are essential for short-term liquidity and emergencies, maintaining a healthy cash flow is critical for the sustained success, growth, and stability of a business. Organizations with strong cash flow management are better positioned to navigate economic downturns, seize opportunities, and thrive in the long run.
Cash on Hand
There is an important need to balance, in every organization’s particular circumstance, how you approach cash on hand, and you need to understand your cash flow forecasting to strike that balance. I’ll use a specific example from my own business, Next Level Growth to help illustrate this.
In the early days, I was a solo-preneur as I left the world of manufacturing and transitioned to coaching. My operating expenses and overheads were low, and the business generated very good cash flow. I had a great facility with a monthly lease just under $5,000, and not many other fixed expenses. I kept about $10,000 of cash on hand in case we had a downturn, but otherwise, I could shut off variable expenses quickly and the delta between monthly cash flow and fixed costs was high, so there was not much to be concerned about.
As I began to build out a firm of business guides, relocated to a new, much larger and more expensive office, and built out significantly more resources and collateral, things changed.
Thinking about how much cash on hand I needed to maintain as a buffer for slow times, I needed to get a clear picture of what my total monthly cost structure was, what was a fully fixed cost, what costs were entirely variable, and what costs were in between the two extremes. In my case, as of the writing of this article, I have just over $70,000 in total monthly expenses required to run our firm.
Some organizations look at cash on hand through the lens of, “If our revenue dropped to zero, how much do I want to have in reserves to survive.” Different leaders have different levels of risk tolerance, and that reality needs to play into the way this is approached. If you have a very low tolerance for risk, this is likely the right approach to give you peace of mind. If, on the other hand, you are highly risk tolerant, this will probably cause you to tie up too much cash, cash that you would rather be redeploying in growth opportunities.
The balance I try to strike is to look at scenarios where we have a drop in revenue of 25% and 50%. When the pandemic hit in 2020, we had a short-term drop in revenue of about 30% and it lasted for about 5 months. When I consider my business model, I could immediately shut off about $20,000 (29%) of the $70,000 monthly spend without having an impact on the quality of how the business operates. These are variable expenses that are nice to afford and do allow us to enhance the way we do things, but they are not necessary for survival or to maintain an on-brand delivery of our services. So I have about $20,000 that is discretionary, which brings my “downturn” monthly nut to about $50,000.
To be able to operate in an environment where revenues and cash in from operations drop 25%, if I carry $50,000 cash on hand, I can go several months without it causing undue harm. In my particular circumstance, if I carry less than that, I’m putting my business at risk in a sudden downturn, and if I carry more, I’m tying up cash that could be reinvested in growing the business.
Cash Flow Forecasting and Staying Ahead of the Curve
Depending on the business model, there are varying degrees of accuracy in 90-day cash forecasting. When I ask the Finance Team leader of a client company about maintaining a cash flow forecast, I sometimes get pushback that, “Our cash flow is too unpredictable to forecast,” or, “There are too many variables for it to be accurate and valuable.” This is usually code for either, “I’m not sure how to do it,” or, “I don’t have time to do the work required.” Either way, if the leader of your finance team is not providing a cash flow forecast (ideally 90 days out) and reviewing it frequently, I would argue they are underperforming in an area that is a significant part of their job. That is a strong statement and one I make for a reason. Regardless of the variabilities that exist in any given industry, based on historical trends, seasonality, and sufficient data, I believe every business can and should maintain a detailed 90-day cash flow forecast, with as much accuracy as their specific business model allows.
If you disagree, go back to the article I wrote on Most Critical Outcome® and read the section titled “MCO In Practice.” I believe the leader of the Finance Team has a fiduciary responsibility to protect the financial health and cash flow of the business. If they are not forecasting cash and reporting to the team on a regular basis, they cannot fulfill their responsibility to protect cash flow.
At Next Level Growth, our cash flows into and out of five different accounts (we use a methodology learned from reading the book Profit First, by Mike Michalowicz). Two are for receiving payments, one is for paying operating expenses, and two are for savings – one for safety-net cash on hand and one for building cash for quarterly taxes.
Our Controller maintains a spreadsheet that pulls from various resources and includes some manual adjustments that shows me the 90-day forecast of cash flow in and out of each account, together with an aggregate column that shows me total forecasted cash looking 90-days out. We have lots of variables too. If I spend more or less than expected on marketing in a given month, the forecast has to be adjusted. If we add a client or lose a client, the forecast has to be adjusted. But knowing what to expect as we predict the next 90 days of cash allows me to see trends and concerns coming long before they arrive…and that helps me make better, more timely decisions and adjustments.
Leading a business without clear and updated cash flow forecasts would be like a pilot leaving on a cross-country trip without checking the weather forecasts along the route or at the destination. I wouldn’t want to be a passenger on that plane.
The Power of One
The last discipline if Growing Profits & Cash Flow that I want to address is what we call the “Power of One.” When it comes to a focus on financial improvements, many teams either don’t know where to start, or they let themselves be too busy to do the work. As a result, their profit and cash flow is a byproduct that just happens to them, not something they intentionally go after and get.
The idea behind the Power of One is to think about all of the things within your control or influence that affect things like your Profit per X and your Cash Conversion Cycle. Take each of them one at a time, and instead of focusing on coming up with some big initiative, think about what it would look like to improve it by 1% or 1 day. Here’s an example.
Let’s say you are an auto dealership with multiple locations selling used cars. Your Profit per X is probably Profit per Unit Sold, so that is the key to your economic engine. If we start by focusing on profit only, I would ask you to make a list of all the things you can control or influence that impact Profit per Unit Sold. That list might look like:
• Reconditioning Cost
• Advertising Expense
• Acquisition Cost
• Transportation Cost
Taking them one by one, perhaps you do some reconditioning in-house and some you outsource. If you brought all of your reconditioning in house, you might be able to save $100 per unit when you consider the additional cost it would take you to expand your recon department combined with the savings of not having to pay an outside vendor.
Perhaps you could make improvements to your referral strategy and your “self-generated traffic” strategy with your sales team, to create more “free” leads and reduce your advertising cost per unit by $50.
If you adjusted your buying strategy to increase the percentage of street buys relative to auction buys, you might find that the savings in auction fees by adjusting the ratios saves you $25 per unit.
Maybe as a byproduct of the buying strategy adjustments and intentionally renegotiating your transportation contracts, you could reduce your transportation per unit by another $25.
All in, the above changes could result in a savings of $200 per unit. If you have 3 locations and each location sells, on average, 1,000 units annually, then your profit will increase by $600,000, and if you keep those gained efficiencies, as your unit sales grow over time as you grow the business, that savings and the resulting gain in profit will grow with you year over year. The long-term impact of just that one exercise, can yield millions of dollars of added profit and cash flow over a period of just a few years.
Pricing Strategy – A Final Thought on The Power of One
Very few organizations I meet really focus on their pricing strategy and, in fact, most of them are quick to discount prices and rarely consider the power of raising prices. I believe organizations should be just as intentional about their pricing strategy as they are on expense management.
I’ll share two brief, and powerful points on this. Think about your favorite restaurant. Let’s just say that the average ticket value for the restaurant is $50 per person. Most companies are afraid to raise prices because they are concerned they will lose too many customers, and restaurants are no different. But consider if, as a guest of the restaurant, they adjusted their prices across the menu by just one to three percent, so that the average ticket value went from $50 to $51 per person. Most people would agree that there would not be any measurable drop-off in traffic or frequency as a result of such a small change. However, if the restaurant has 20 locations, and they average 100 guests per evening per location, that’s $2,000 per evening. If they are open six nights per week that’s $12,000 per week, times fifty-two weeks. That turns into $624,000 of additional gained profit over the course of a year.
If a business operates on a 50% gross margin, they could raise prices 2% and afford to lose 3.85% of their volume, or in the case of the restaurant, their traffic, and still generate the same dollars of gross profit. If their gross margin was 30%, they could afford to lose up to 6.25% of their volume and still generate the same dollars of gross profit (see the download below for your own copy of the referenced tables). If their volumed drops by less than those amounts, their real dollars of Gross and Net Profit go up.
The second point I want you to consider is the negative real impact on gross profit dollars of discounting your prices. Typically, discounts happen in the range of 10% or more. For this example, take the same company operating at a gross margin of 50%. If they decided to discount their prices by 10% to attract more sales, they would need to see an increase in volume, or traffic, of 25% just to generate the same dollars of gross profit. If their gross margin was only 30%, they would need to see volume increase by 50% just to keep the same actual dollars of gross profit flowing into the business with a 10% discount on price. Discounts are dangerous and almost never generate enough increase in volume to offset the loss of real dollars of gross profit they cause.
Download a free copy of the Price Increases, Discounts, and Impact on Gross Profit Dollars Tables.
You Must Do the Work to Get the Results
These are the key disciplines that, if you will begin to focus on them and prioritize them, will yield outstanding results over time, and they will yield results that will remain with you for the life of your business.
We have a quote from author Larry Winget on the wall in one of our hallways at Next Level Growth that says, “The only thing standing between you and what you want, is you and what you are not willing to do.” Intentionally growing profits and cash flow is hard work because it requires you to spend time working on your business, not in it.
Would it be a ridiculous idea to have a conversation with a Next Level Growth Business Guide to learn more about our approach and how we can help you build an elite organization? Are you against filling out the form below have a free conversation? You may be one simple step away from a whole new level…the Next Level. What have you got to lose?
Next Steps
- Get your copy of the book: Five Obsessions of Elite Organizations on Amazon/Audible.
- Catch up on the articles you may have missed in this series:
A Culture of Performance – The fourth of the Five Obsessions of Elite Organizations®

Optimized Playbooks – The third of the Five Obsessions of Elite Organizations®

Unlocking Greatness: The Five Obsessions of Elite Organizations®
- Start a conversation with us today to learn about our unique approach to taking your business, and your life, to the Next Level.