 Skip to content
 Founder Fatigue Is Real—Here’s How Elite Organizations Prevent It

Founder fatigue is one of the biggest threats to your business. Learn how elite entrepreneurs prevent burnout by realigning purpose, eliminating what drains them, and building companies that deliver both profit and joy.
The 90-90-1 Rule: Why Most Entrepreneurs Stay Stuck (And How to Break Free)

Most entrepreneurs stay stuck, not because they lack ideas, but because they ignore the one habit that actually moves the needle. The 90-90-1 Rule is a game-changer for focus, execution, and growth. Ready to break free? Here’s how.
Your Employees Are Clueless About Money—And It’s Costing You a Fortune

Think your employees understand company finances? This dead-simple $100 exercise flips the switch, gets them thinking like owners, and pumps up your bottom line. Don’t skip this.
Growing Profits and Cash Flow – The fifth of the Five Obsessions of Elite Organizations®

Learn about the fifth of the Five Obsessions of Elite Organizations® – Growing Profits & Cash Flow. Explore five practical disciplines, including Internal Financial Literacy and Cash Flow Forecasting, to swiftly enhance both profitability and net cash flow.
A Culture of Performance – The fourth of the Five Obsessions of Elite Organizations®
Explore what it truly takes to build a Culture of Performance. Learn why activity is not achievement, and how elite organizations align great people, clear expectations, and disciplined systems to consistently achieve meaningful results.
Unlocking Greatness: The Five Obsessions of Elite Organizations®
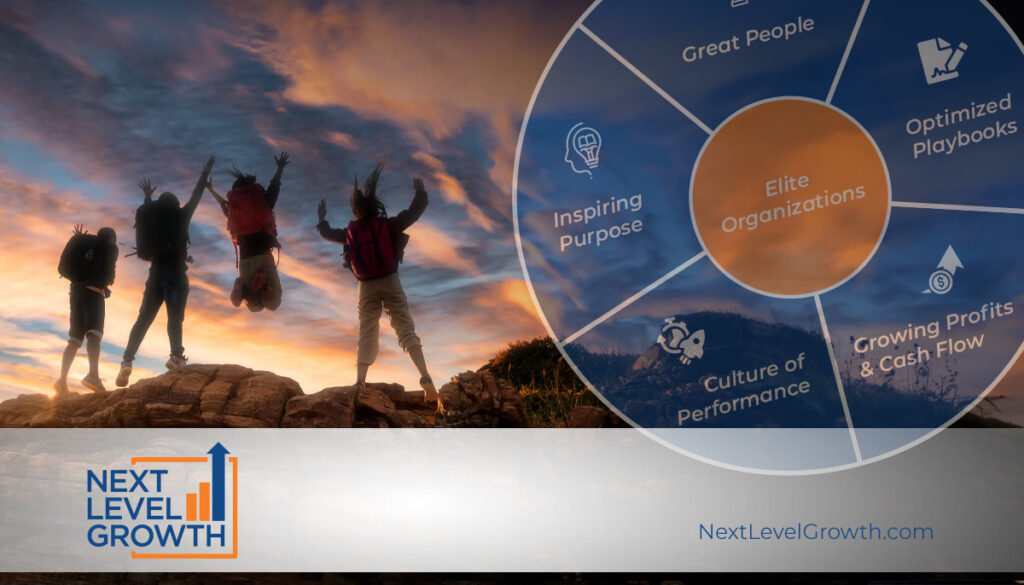
Explore the path from “good” to “great” in business with insights from Next Level Growth. Discover the Five Obsessions of Elite Organizations™, including Great People, Inspiring Purpose, Optimized Playbooks, Culture of Performance, and Growing Profits. Join us on this journey to elevate your organization’s performance and success.
Clear the Fog for Better Decision Making
How often do you pay “Dumb Taxes” in your business? I just finished the Audio Book The Road Less Stupid by Keith J. Cunningham and, spoiler alert, the book is about why smart people do dumb things. The author asks the reader, “how much money would you have right now if I gave you the ability to …
Take Your Business, and Your Life, to the Next Level

“It is dangerous not to evolve.” Jeff Bezos After six fantastic years as The Traction Hub, the time to evolve has come. The Traction Hub is now Next Level Growth. Keep reading to learn what makes us different and more valuable in the world of business operating systems and coaching. After six years as one of the …
Just Say “No” to Achieve Growth

Have you ever said yes to something and then regretted the commitment you made? If so, you’re normal. Saying no is difficult for two primary reasons, which I will share below. But being able to say no is essential in creating the capacity to say yes to, and to be successful at, what is truly …